Healthy eating issues are very serious and we need to be aware of what we are eating as it affects our health, our mental preparedness for working and our general mood.
As part of our stats investigation we are designing new mini topics to investigate in our maths groups.
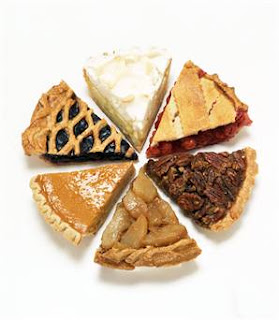
Today one group visited the local bakery to gather data on what ratios/proportions/percentages/fractions of the food available were healthy or unhealthy. Our first group gathered data in two ways - as a tally chart in food groups and as a visual representation based on the cabinets and what they were filled with. To follow up, the girls decided to put the data into a pie chart. Then they decided to make an actual pie, bring it to class, divide it up in to the correctly proportioned sections, photograph it, eat it, upload the images and written descriptions to either their blogs or wikis as evidence of their learning.
After that, they can transfer the new knowledge into a health lesson and as a recommendation report for the canteen.
:-)

16 comments:
Our group is going to do our statistical investigation on the dairy vs the canteen. We have three main catergories, health, taste and price.
Healthy eating is very important even if it doesnt show on the outside you can still feel it in the inside!!!!!!
BUBBLES RULES :D
The Pi People really enjoyed the bakery food today and have some cool ideas on how to present our data.
I think that our investigation is going to go pretty well.
NZ 4eva :)
Well I for one really enjoyed the food from the bakery today. The steak and cheese pies they make have probably got allot of fat in them but they are so nice.
Our groups idea is great because I thought of it. We are checking out the cateens foods nutritionul value and finding out how many laps of the field it takes to burn of those chubby calories.
I like the idea of making a pie chart out of real pie (but what kind?)apple is my favorite. Our group is taking that idea and twisting it around a bit, we are going to make a bar chart out of chocolate bars cut into different sizes. Please comment on other ways you could alter the pie idea.
hello. i found this very interesting. it was very statistical yet fun at the same time haha. but yeah i can't wait to finish doing this task!!
oh and please go cheek out my blog i need some more page views lol
It is going to be really interesting to see the final results i think the idea of making a pie chart out of pie is really creative!!!
I'm in Karate Kid's group :)
I'll do the eating, just not the running bit :) :) :)
I'm in the karate kids group aswell.
I will do the eating but probably not the running!
=)
I really enjoyed the investigation that we did today, it was educational and fun! I think everyone is going to enjoy the cool ways we are going to present our data!
:] :] :] :] :] :] :] :] :]
this is a very good idea mr.woody i would say what we were doing but bubbles allready said it
Hi Mr Woody!! I'd just like to say that I have taken off who wants to be a millionaire so there isn't any music playing. :) And I also posted that thing about why animals are so cute.
im in mysteryman's group
I dont care what we do to show our results as long as we get to eat it afterwards.
Awesome! I'm In bubbles,bobby,aresnal 4 life, mouswheel,yams, and frozen tree's gruop we are doing canteen vs dairy! Who's gonna win?
Yum!! I like cheescake! I think I would probably compare the dairy to a bakery or something like that.
Post a Comment