Healthy eating issues are very serious and we need to be aware of what we are eating as it affects our health, our mental preparedness for working and our general mood.
As part of our stats investigation we are designing new mini topics to investigate in our maths groups.
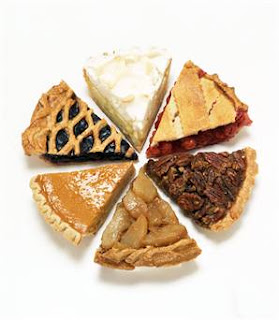
Today one group visited the local bakery to gather data on what ratios/proportions/percentages/fractions of the food available were healthy or unhealthy. Our first group gathered data in two ways - as a tally chart in food groups and as a visual representation based on the cabinets and what they were filled with. To follow up, the girls decided to put the data into a pie chart. Then they decided to make an actual pie, bring it to class, divide it up in to the correctly proportioned sections, photograph it, eat it, upload the images and written descriptions to either their blogs or wikis as evidence of their learning.
After that, they can transfer the new knowledge into a health lesson and as a recommendation report for the canteen.
:-)


